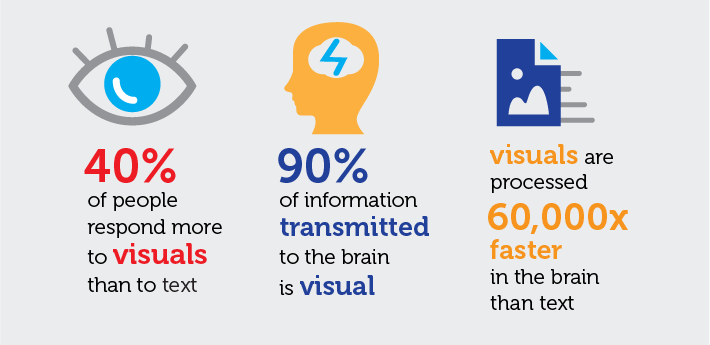
The power of pictures: how we can use images to promote and communicate science? It’s a fact—a single image is worth a thousand words; but there is additional real value in using images to promote scientific content. Visual content drives engagement, and images help us learn. They grab our attention, inspire us and help explain difficult concepts.
How the Brain Responds to Images
We are very visual creatures.

Our desire to see images lies with our reasoning and ability to pay attention. Images are able to catch our notice easily and we are immediately drawn to them. The human brain is able to recognize a familiar object within 100 milliseconds, so when we see a picture, we are quick to analyze it. Also, bright colors capture our attention because our brains are wired to react to them. Our vision senses are by far our most active of the senses. That’s why presenting visual content in conjunction with scientific data will speed up the understanding process.
Learning is More Effective With Images
Reading can be a slow and time-consuming activity as it takes more time to read a sentence than to evaluate a visual scene. In school students rely on textbooks and memorization of text, but that isn’t effective for everyone. Because many people are visual learners, they would memorize subject matter more successfully through image-based content.

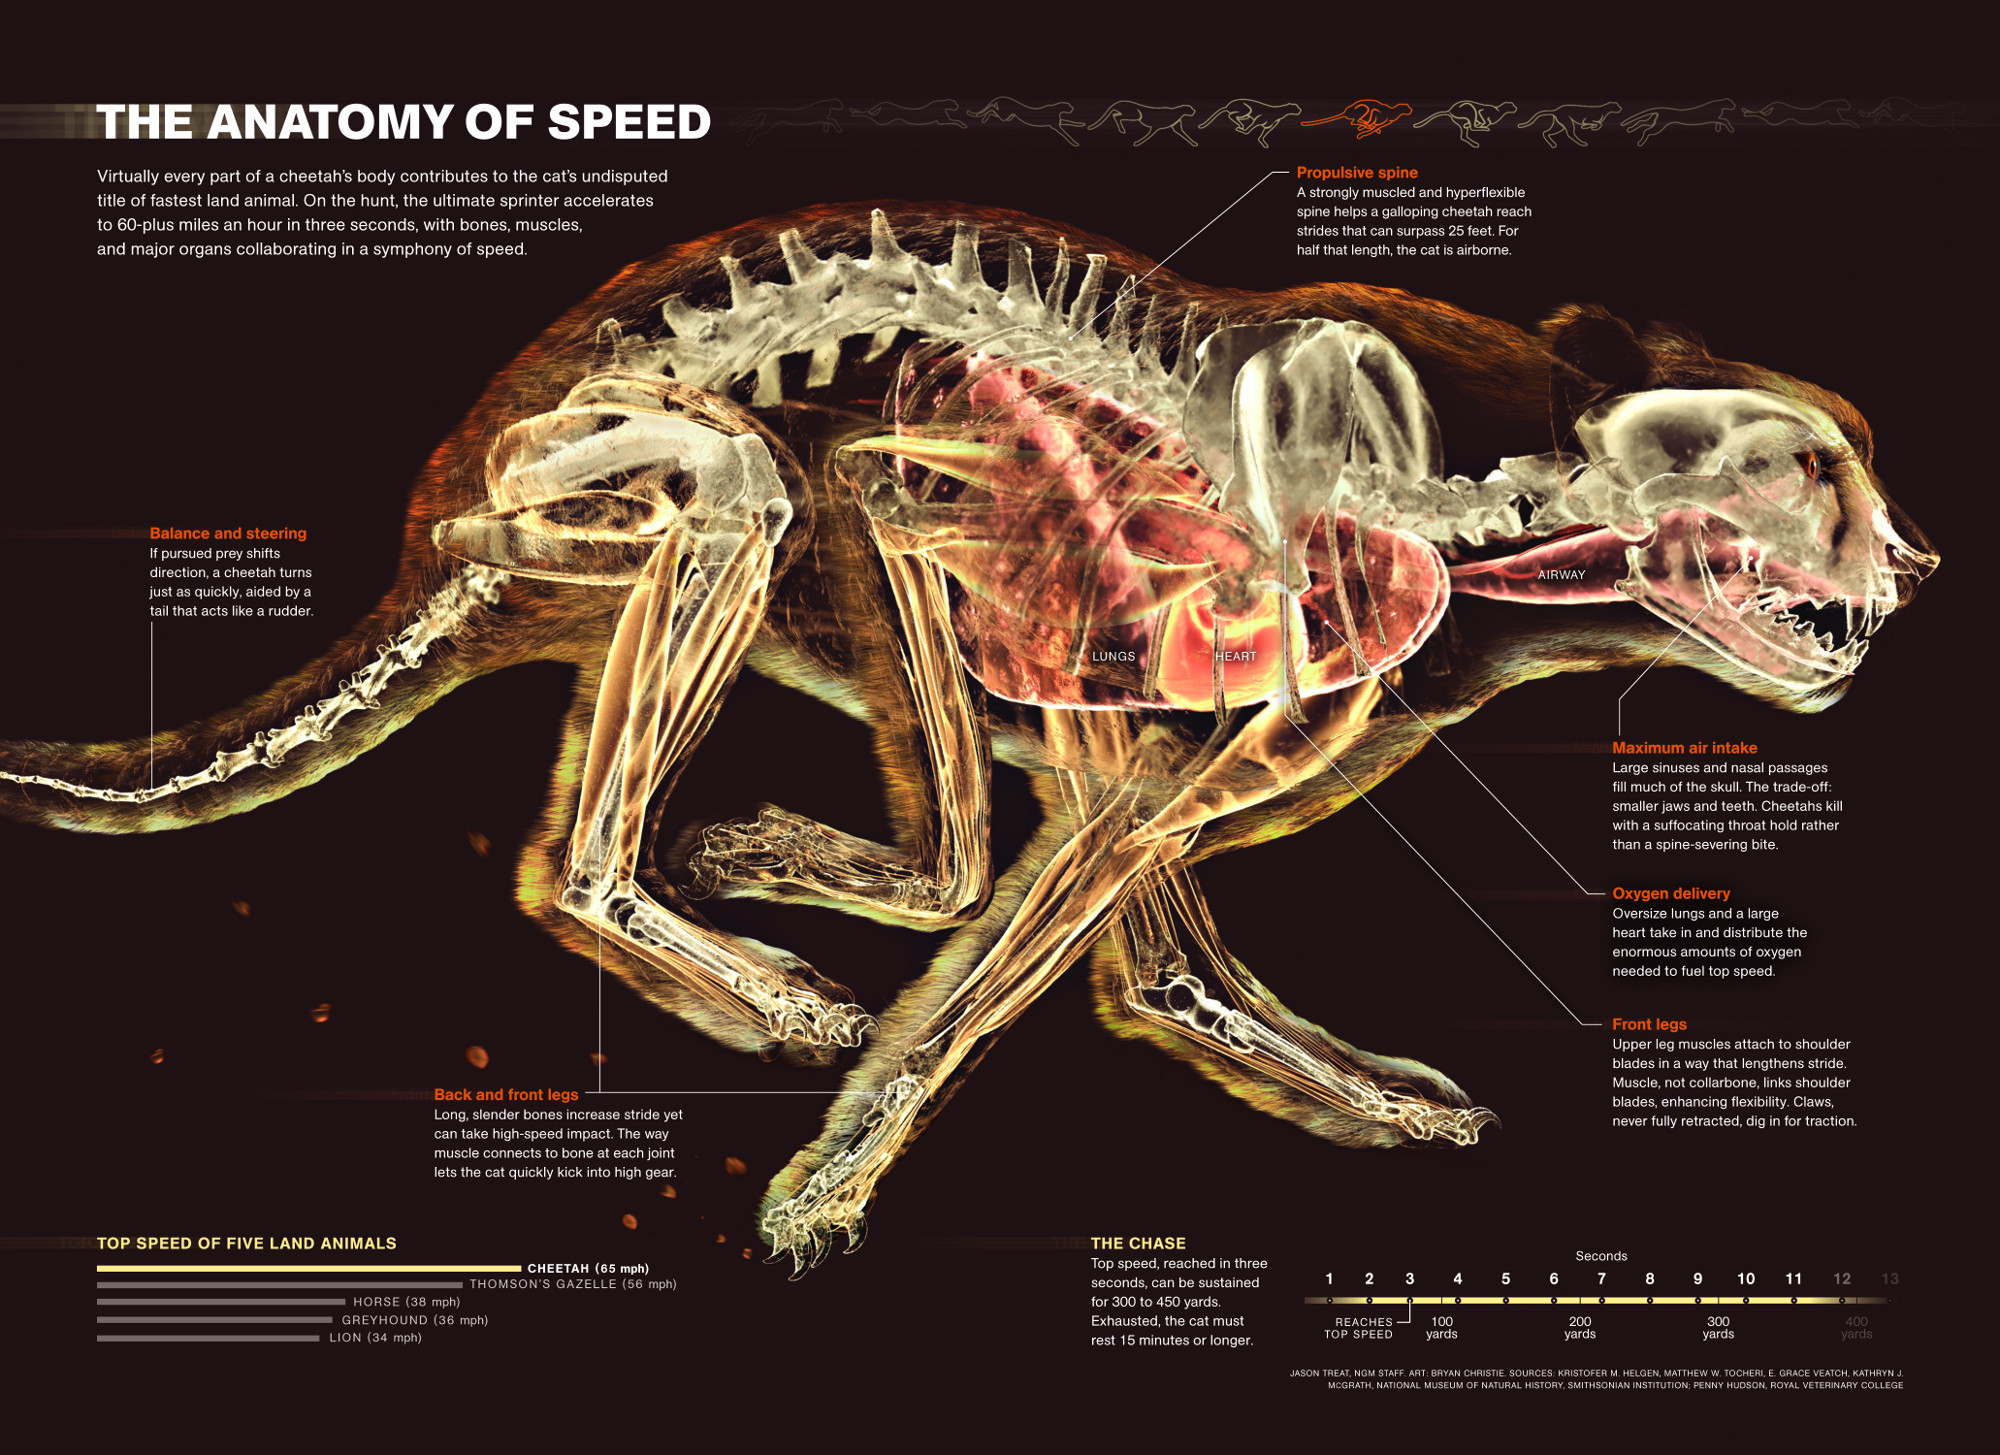
That’s why infographics are getting more popular. Science based infographics are increasingly being used to break down complex messages or tell interesting stories about scientific discoveries.

The above infographic was developed as a visual guide of NASA’s Curiosity rover landing in August 2012. It took the art team at Nature magazine over a week to complete the featured mission. Using source images from NASA as a jumping off point, the team was challenged to provide both legible and seamless information design.
Since infographics compress the data or findings and present them in easy to digest visuals, the images, graphics and figures in infographics make the learning process easily accessible and memorable. They can appeal to a much wider range of audiences and bring in non-specialist interest as well.
Images help us become involved. With images, we are engaged in the science, rather than just being an outsider looking in. Images help contribute to the storytelling process that can make science more immersive.
Thanks to open access and open data, infographics and custom content are becoming more available to the public. And in turn, if we are able to combine visual and written data, we create a product that will connect, educate and ultimately engage us all in the sometimes perplexing world that is scientific research.

